

How to use the map
The interactive map is one of the key features of the Maynooth Decarbonising Zone Information Hub. It helps people explore climate action across Maynooth by place, showing where projects, activities and examples are located across the Decarbonising Zone.
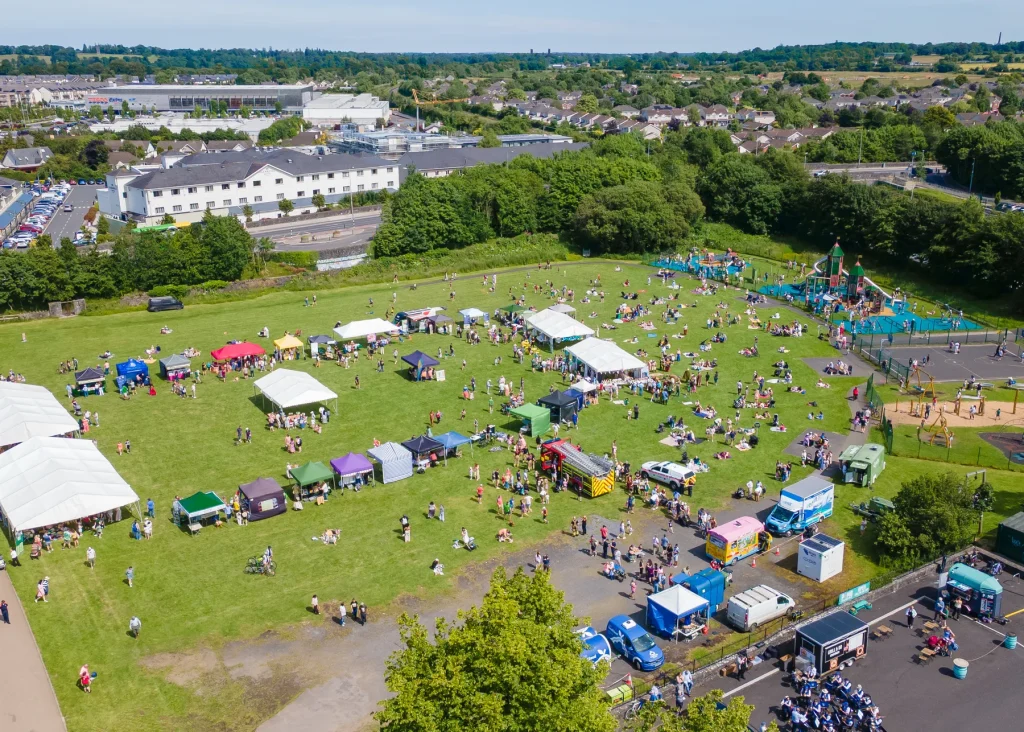
Explore the Interactive Map
Climate action can sometimes feel abstract or difficult to picture. The map makes it more local and visible by connecting projects and actions to real places across the town. It helps users see what is happening in Maynooth and how different activities contribute to the wider DZ.
Users can explore local projects, learn more about individual sites, find examples near them, and follow links from map points to fuller project pages, case studies or related information pages.
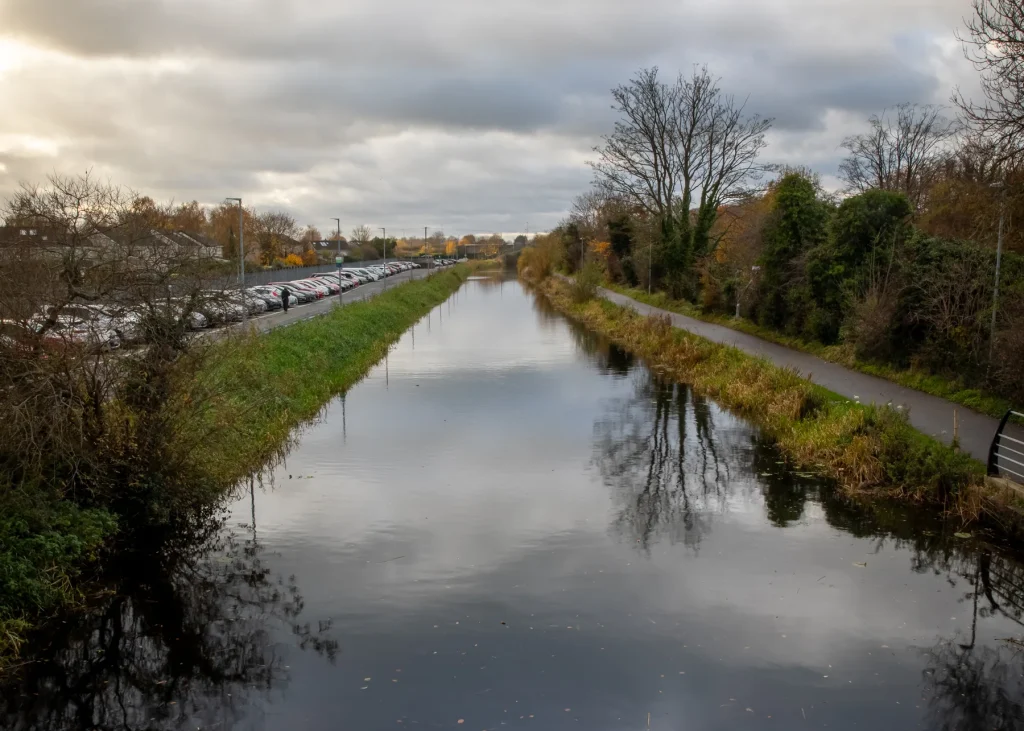
Explore climate action across Maynooth
Across Maynooth, climate action takes many forms. It includes energy projects, active travel improvements, biodiversity work, community initiatives, public realm improvements, education and awareness activities, circular economy projects, sustainable transport actions, nature-based solutions and more.
The map brings these examples together in one place. It shows that the Maynooth DZ is not focused on one single project or one single location. Instead, it is made up of many actions, large and small, across different parts of the town.
The map includes projects that are complete, underway, planned or developing over time. This helps users understand the wider picture and see how individual projects form part of the overall DZ story.
What the map shows
The map shows selected projects, activities and locations connected to the Maynooth DZ.
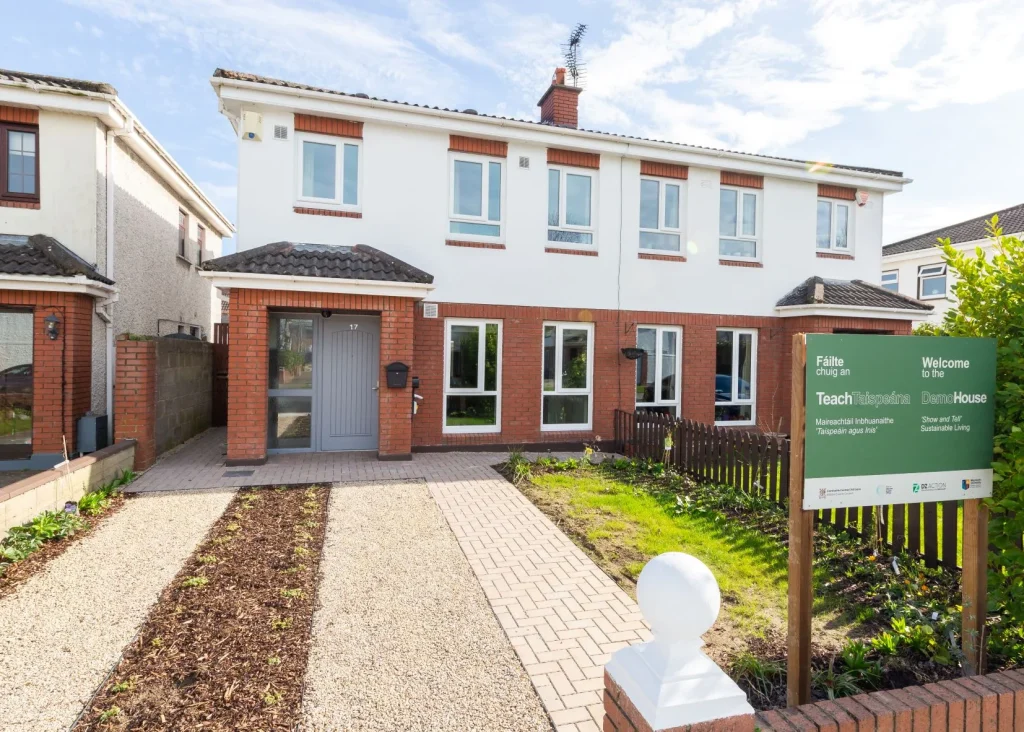
These include:
-
local climate action projects;
-
energy and retrofit examples;
-
sustainable transport and active travel projects;
-
biodiversity and nature-based action;
-
public spaces and green infrastructure;
-
community projects and initiatives;
-
education and awareness activities;
-
circular economy and resource-use projects;
-
water, drainage and climate resilience examples;
-
case studies linked to specific locations.
Each map point includes a short summary and links to further information. Depending on the project, this may include a full project page, case study page, related information page, image, project category, location details and project status.
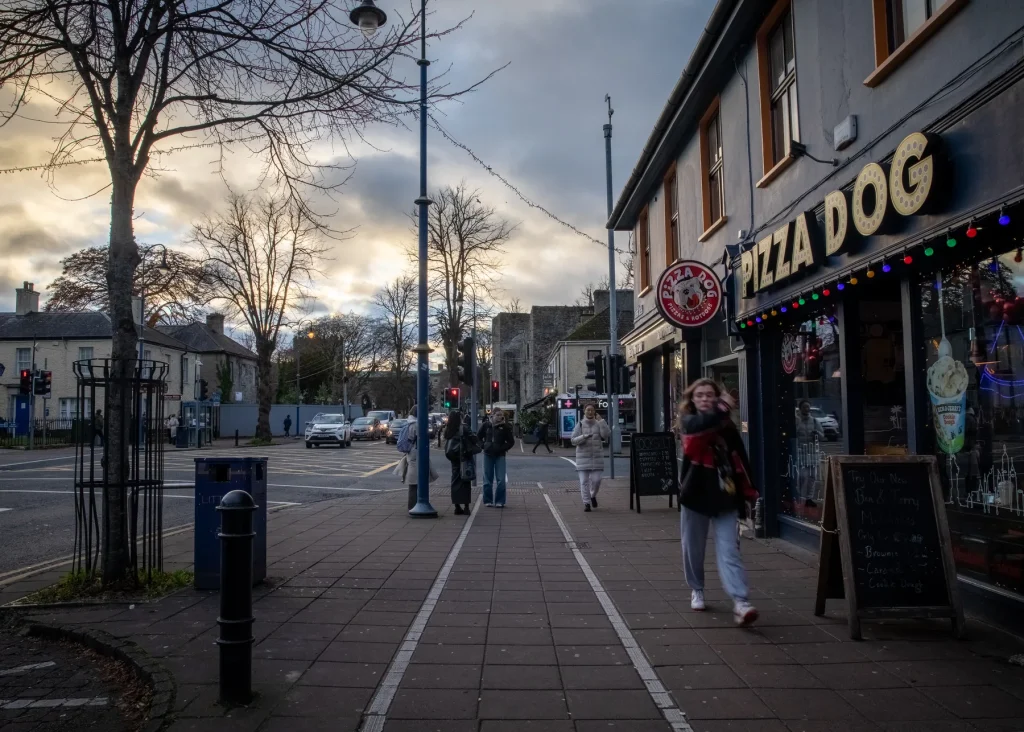
How to use the map
The map is designed to be simple and easy to use.
Users can explore the Maynooth DZ by looking at different locations across the town. They can click or tap on project points to open short summaries and then follow links to learn more.
The map helps users to:
-
find projects near them;
-
see where different types of climate action are happening;
-
explore projects by topic or category;
-
understand how local places connect to the wider DZ;
-
move from a map point to a full project, case study or information page;
-
discover projects and examples they may not already know about.
The map acts as a visual starting point for the wider Hub. It helps users find their way into more detailed information without overwhelming them on the map itself.
Project categories and filters
The map includes categories and filters so users can explore the information in different ways.
The map categories include:
-
energy;
-
retrofit;
-
transport;
-
biodiversity;
-
green infrastructure;
-
community action;
-
public realm;
-
education and awareness;
-
circular economy;
-
water and nature-based solutions.
These filters allow users to focus on the themes that interest them most. For example, someone interested in biodiversity can view nature-related projects. Someone interested in transport can find walking, cycling, public transport or movement-related actions. A community group can identify community-led projects or examples that may inspire further local action.
The category structure also supports map icons, colours and project summaries, helping users quickly understand the type of action shown at each location.
Connecting places, projects and stories
The map does more than show locations. It connects places, projects and stories.
Each map point acts as an entry point into the wider Information Hub. A short map summary introduces the project or location, while the linked project page or case study provides more detail on what the project is, who is involved, what it aims to achieve and how it supports climate action, sustainability or biodiversity.
This approach helps users see how local action works in practice. It also shows that different types of action are connected. For example, a public space project may support biodiversity, provide shade, manage rainwater, encourage walking and improve the look and feel of an area. A transport project may reduce emissions, make journeys safer and connect people to schools, services, public transport and community spaces.
By connecting projects to real places, the map makes the Maynooth DZ easier to understand and explore.
A map that grows over time
The interactive map grows as the Maynooth DZ develops.
At launch, the map includes an initial set of projects and case studies. Over time, new projects, locations, updates and examples are added. This helps the map remain useful and current as the DZ continues to evolve.
The map also helps show progress. As new actions are added, users can see how climate action is developing across Maynooth and how different projects contribute to the wider effort.
This means the map is a living part of the Information Hub, not a one-off feature.
Using the map with project pages and case studies
The map connects directly to local project pages, case studies and related information pages.
Each map point includes a short, accessible summary. Users who want more detail can follow a link to a full page with information such as:
-
what the project is;
-
where it is located;
-
who is involved;
-
what stage it is at;
-
what climate, sustainability or biodiversity benefits it provides;
-
what has been learned;
-
how it connects to other actions in Maynooth;
-
where to find further information.
This keeps the map clear and easy to use while allowing the project pages and case studies to provide fuller detail.
Explore local projects
The interactive map is one of the main ways to discover what is happening across the Maynooth DZ. Users can also visit the Local Projects and Case Studies section for more detailed information on individual projects.
Together, the map and project pages help tell the wider story of climate action in Maynooth. They show where actions are happening, what they involve, who is taking part and how they contribute to a more sustainable, resilient and nature-friendly town.
As new projects and examples are added, the map continues to help people explore, learn and connect with local climate action.